A dashboard can fail in two ways: it can show every available metric, or it can show a polished summary with no path to diagnosis. A strong B2B dashboard starts with the operating questions and preserves the funnel definitions behind every number.
The three layers, metric tree and review rhythm below are GrandMa's editorial recommendations. The cited product documentation supports specific metric definitions and reporting limitations, rather than prescribing this dashboard design.
1. Design three layers
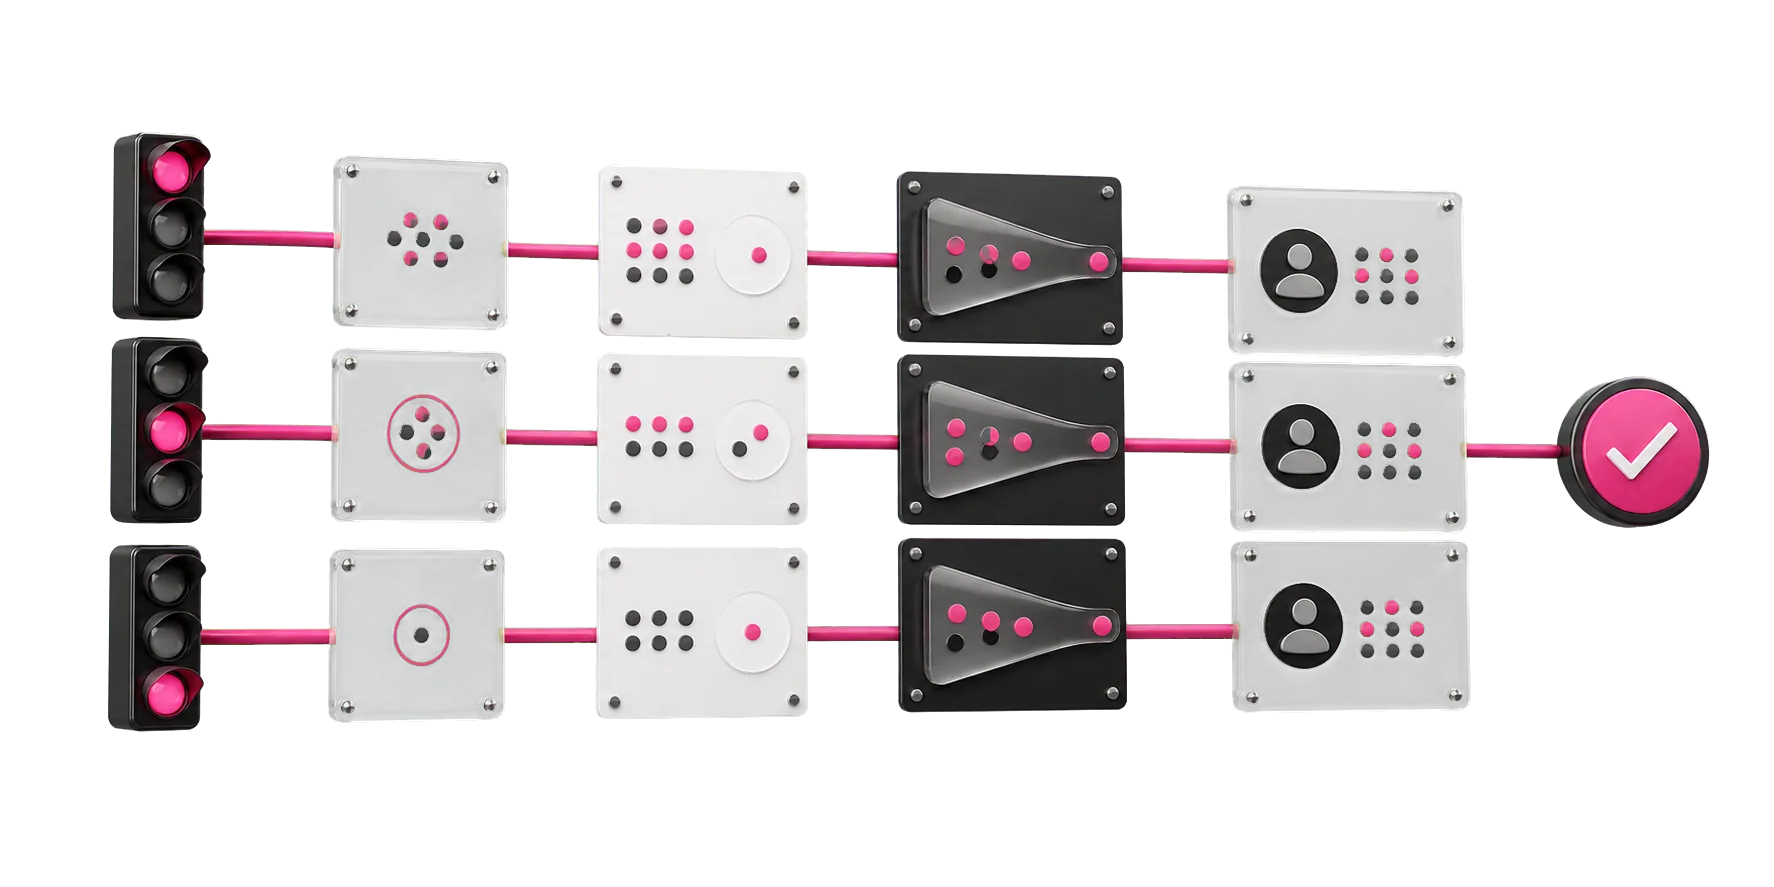
The executive layer answers whether growth is on plan. The operating layer explains channel, campaign, market and funnel drivers. The diagnostic layer exposes landing pages, search terms, forms, sales stages and data-quality checks.
2. Use a pipeline metric tree
Start with qualified pipeline or revenue, then decompose it. Define unweighted qualified pipeline as the sum of the amounts of opportunities that meet your qualification criteria, with explicit stage filters and an as-of date. Opportunity count multiplied by average opportunity amount gives the same total only for the same included set. Opportunities depend on lead volume, qualification and sales acceptance. Traffic metrics explain upstream movement but should not replace commercial outcomes.
Keep weighted pipeline separate. HubSpot's Weighted pipeline forecast multiplies each deal's Amount by its deal-stage probability and sums the results. Label the probability basis; this calculation is not realized revenue. HubSpot also documents funnel conversion rates, time in stage and deal loss reasons as separate reports. [2]
Hypothetical worked example: two open, qualified opportunities in the same currency and snapshot have amounts of €20,000 and €40,000. Unweighted pipeline is €60,000. With assumed stage probabilities of 25% and 50%, weighted pipeline is (€20,000 × 0.25) + (€40,000 × 0.50) = €25,000. These invented probabilities are illustrative, not benchmarks; neither total is booked revenue.
Our decision in this hypothetical scenario: ask the owner of the €40,000 opportunity to verify the evidence for its current stage and confirm the next buyer step before the next weekly review. It contributes €20,000, or 80%, of weighted pipeline, so a change in that one deal would materially change the total. This review priority assumes current CRM records and consistent qualification criteria; if either is uncertain, reconcile the records first. The two amounts and assumed probabilities alone do not justify increasing the marketing budget or treating the forecast as committed revenue.
Map platform labels to your CRM definitions. In Google Ads, a qualified lead is a Google-generated lead further qualified offline in a CRM or internal lead system. A converted lead has completed a chosen step in your conversion process; that step can be a sale, but does not have to be. Keep initial leads, qualified leads, sales-accepted opportunities and won outcomes separately labeled. [1]
3. Make definitions visible
Every KPI needs formula, source, refresh cadence, owner, exclusions and known limitations. Show the date range, timezone, currency and attribution basis on the dashboard. When CRM and analytics differ, label the intended use of each source instead of silently blending them.
Name the date basis as well as the date range. Google's cross-channel Conversion performance report distinguishes conversion time, when the conversion occurred, from interaction time, when the ad interaction leading to it occurred. It also allows Analytics or Google Ads reporting settings; the feature may not be available to every Analytics property. Before comparing sources, check selected conversions, settings and date basis. [3]
A dashboard refresh does not mean source data is final. Google says GA4 processing can take 24-48 hours; intraday data can have temporary traffic-source gaps, and key-event attribution credit can change for up to 12 days. Show the last successful refresh and mark recent periods as provisional according to each source's processing limits. Do not treat these intervals as a guarantee that every figure is final afterward. [5]
4. Attach an operating rhythm
Use weekly reviews for pacing, anomalies and immediate actions; monthly reviews for validated drivers and budget changes; quarterly reviews for targets, channel roles and experiments. Every review should end with owner, action, due date and expected metric movement.